
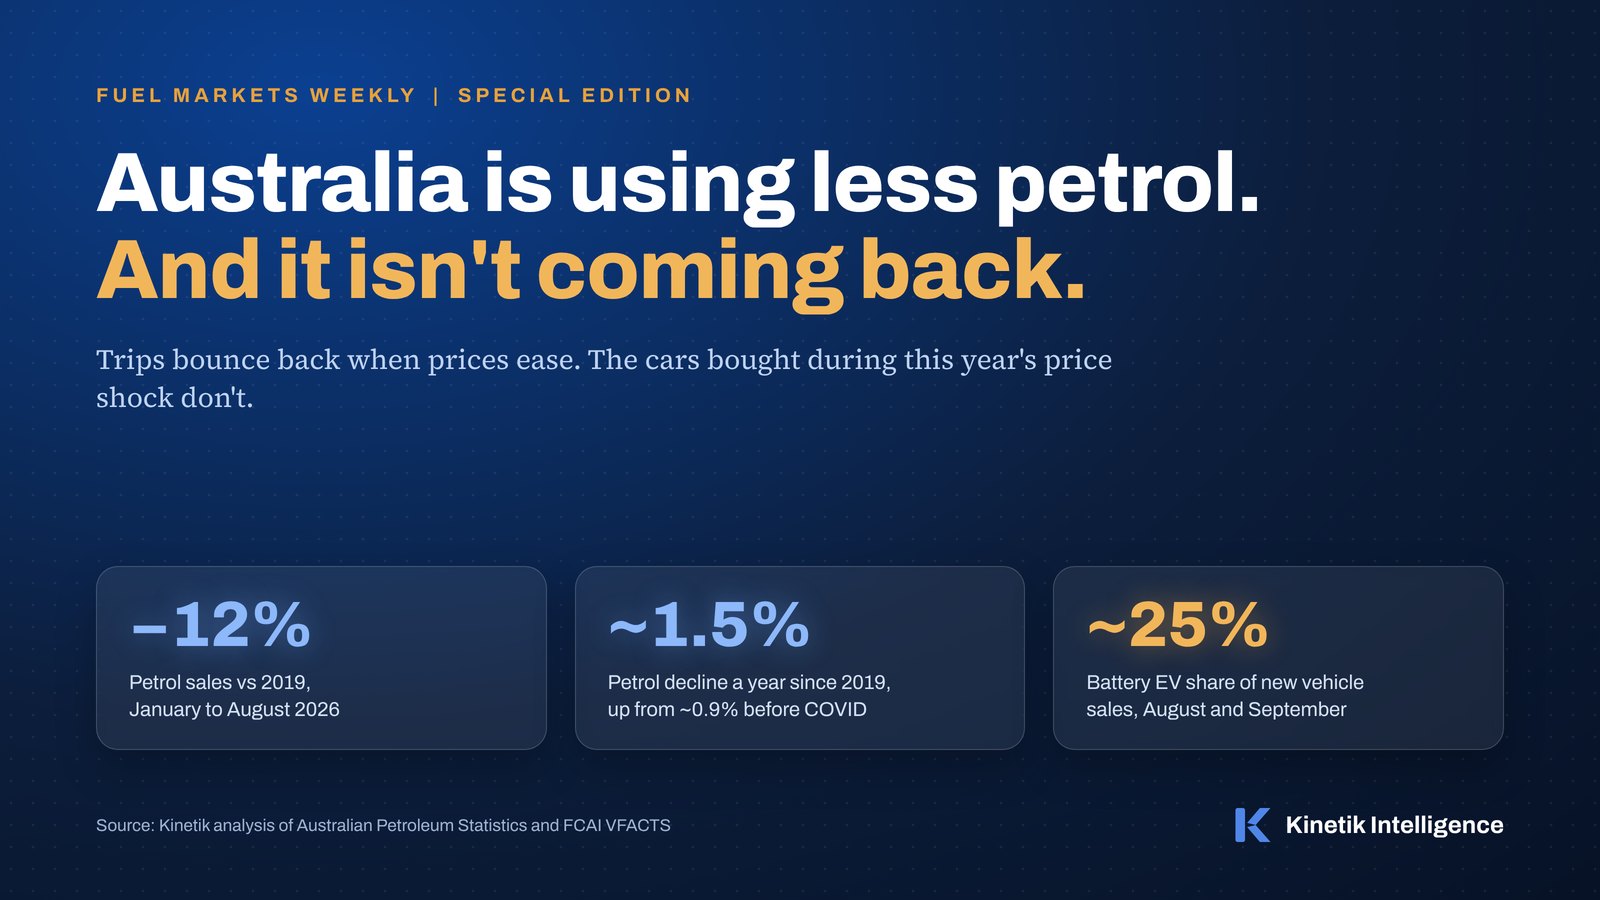
Australians are buying less petrol, and this year's price shock has made the trend impossible to ignore. So far in 2026, petrol sales across all four grades (ULP91, E10, Premium 95 and Premium 98) are 12% below the same months of 2019. Before COVID, demand was easing by ~0.9% a year. Since 2019, it has been falling at ~1.5% a year, nearly double. And in August, diesel, the fuel that has been carrying the industry, turned negative, with its biggest fall of the year.
The easy explanation is EVs. It's only part of the story. To understand where demand goes next, you have to separate what will bounce back from what won't.
A price shock on top of a trend
Petrol demand reacts to price quickly. It fell ~7% in April and May after ULP91 pump prices peaked at the end of March, and fell again in July and August as the excise cut was unwound in two steps. Only March and June beat last year.
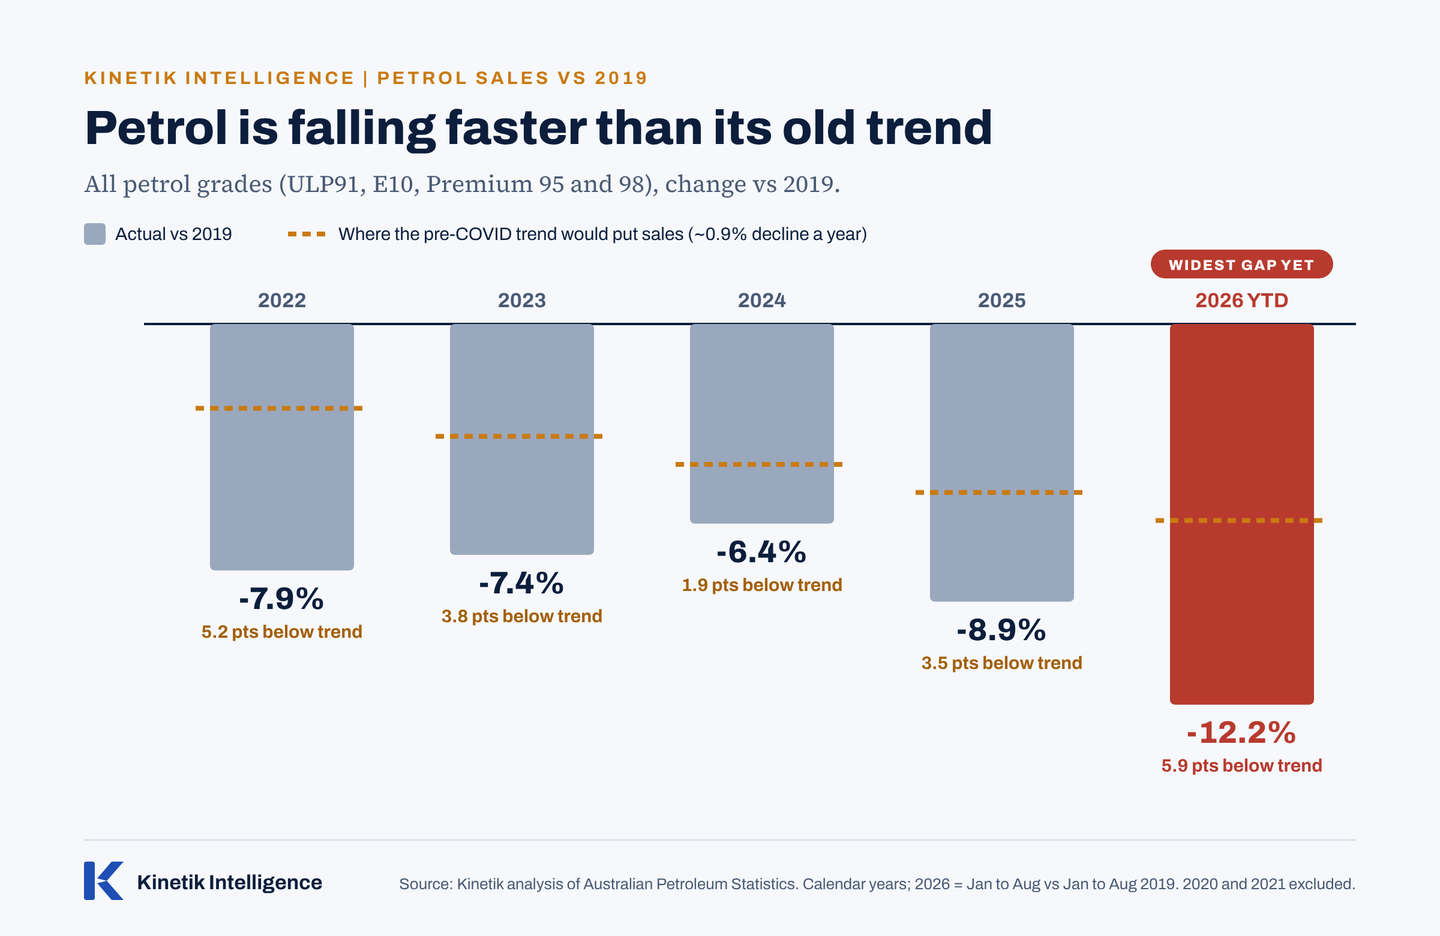
The price shock sits on top of a longer trend. Petrol never recovered from COVID. Every year since, sales have run well below where the old trend would put them, and this year the gap is the widest yet.
ULP91 is up ~37 cents a litre at the pump since early September, which isn't in the data yet. I'd expect the fourth quarter to fall again if prices continue to rise.
Every state is down, but not for the same reasons
Petrol sales are lower than last year in every state and territory. The interesting part is the difference between a state hit by this year's shock and a state in long-run decline.
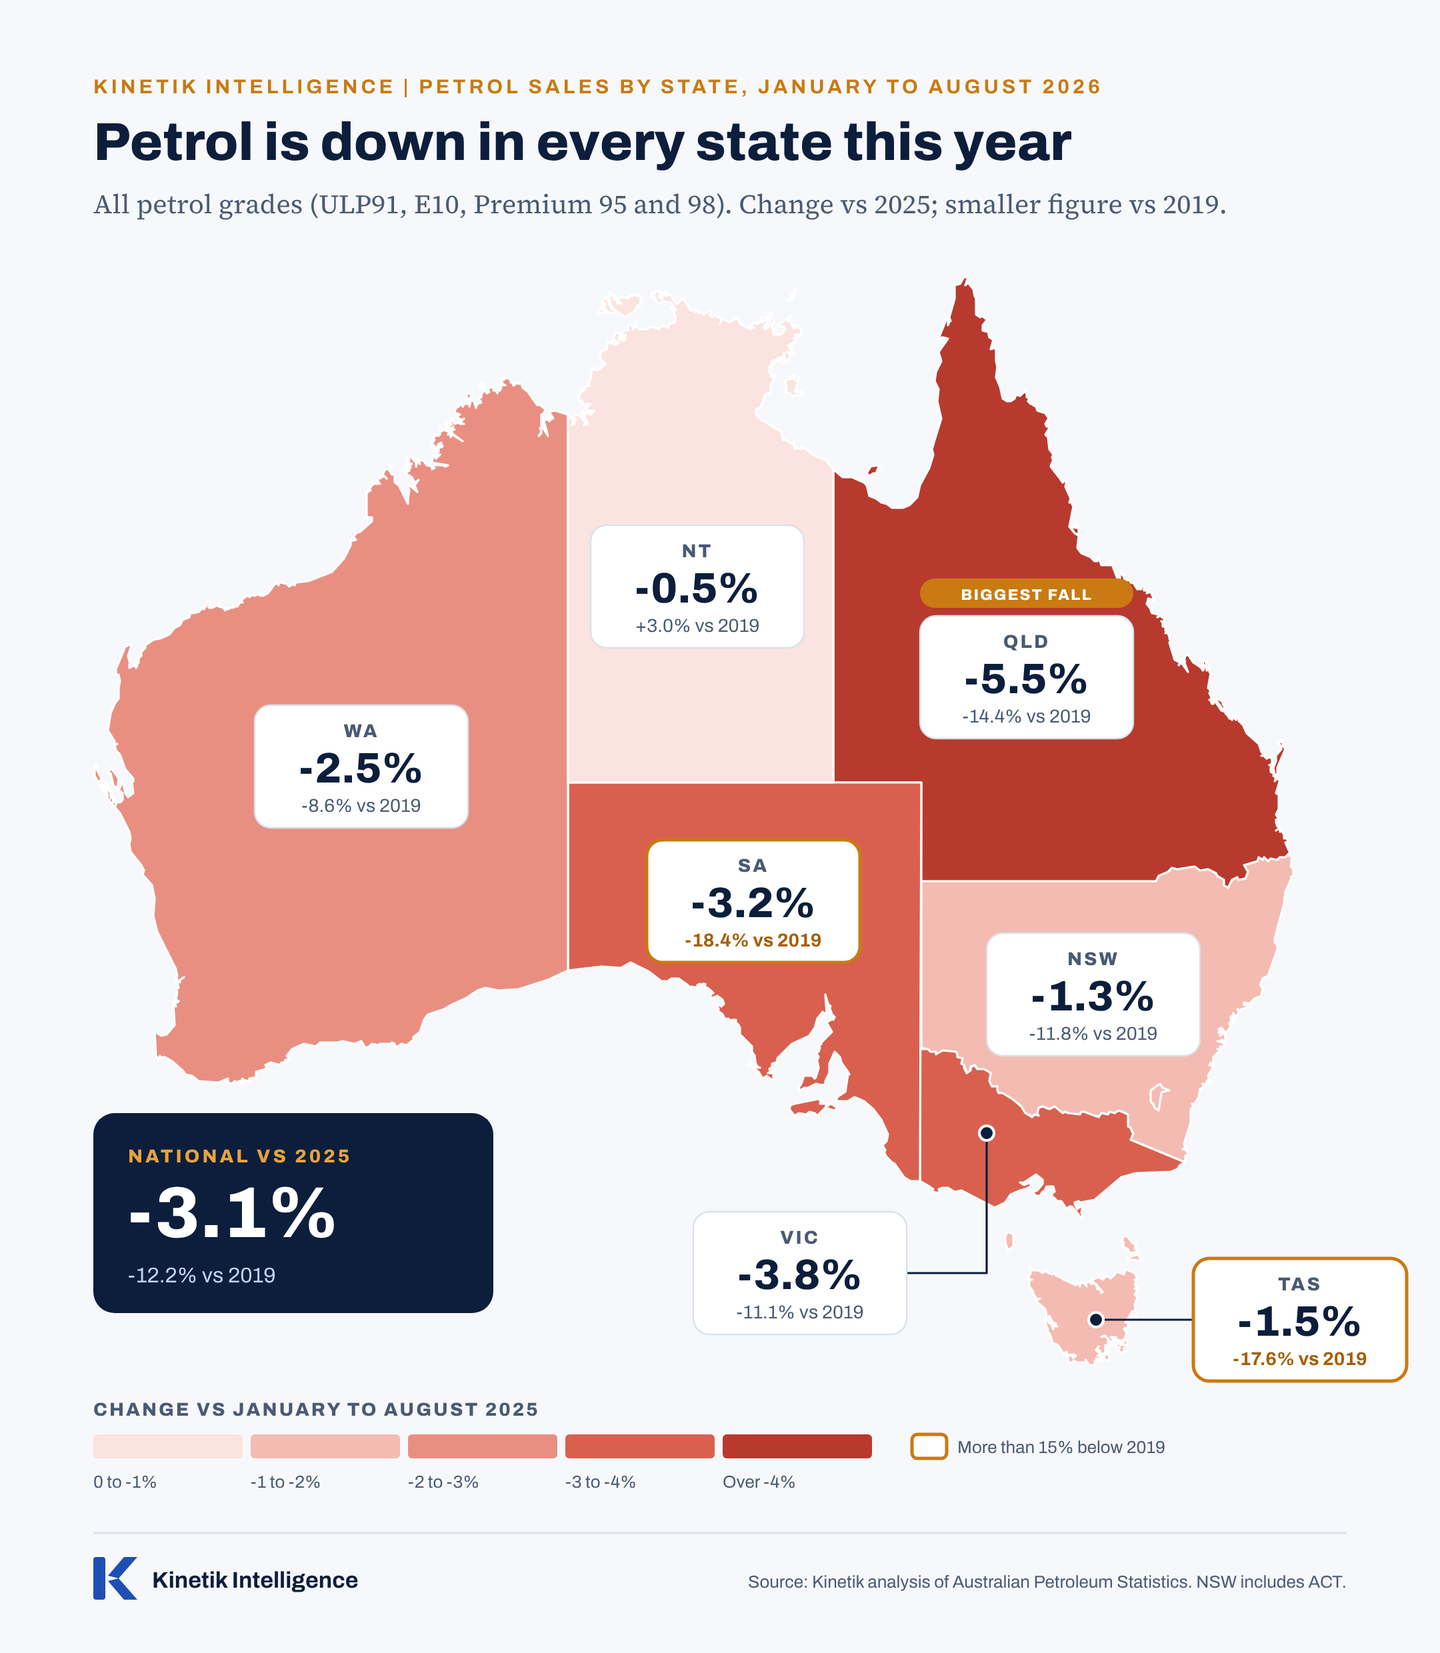
- Queensland took the biggest hit this year. Every grade is down, and August was 12% below last year.
- South Australia and Tasmania are the long-run story. This year's falls are modest, but both are ~18% below 2019. That isn't a price shock; that's structural.
- New South Wales has held up best, and the Northern Territory is the only part of the country still above 2019.
The grades tell a story too, because they haven't moved together. ULP91 is more than half of all petrol sold, and it's down 2.1% on last year and 13% on 2019. E10 is down 4.6% this year and ~31% below 2019, a decline that started long before this year. Premium 95 has barely moved, down 1.1%. Premium 98 took the biggest hit: down 6.0% nationally and 3% to 8% in every state that reports it, and premium's share of petrol sales dropped from 35.7% in February to 32.0% in April. A shift that fast points to drivers trading down. The twist is that Premium 98 is still the only grade above 2019, up 4.7%, so this year's fall cut into years of growth.
Diesel is the other half of the story
Diesel now sells more than twice the volume of petrol, and it has been moving the opposite way. While petrol is 12% below 2019, diesel is 14% above it.
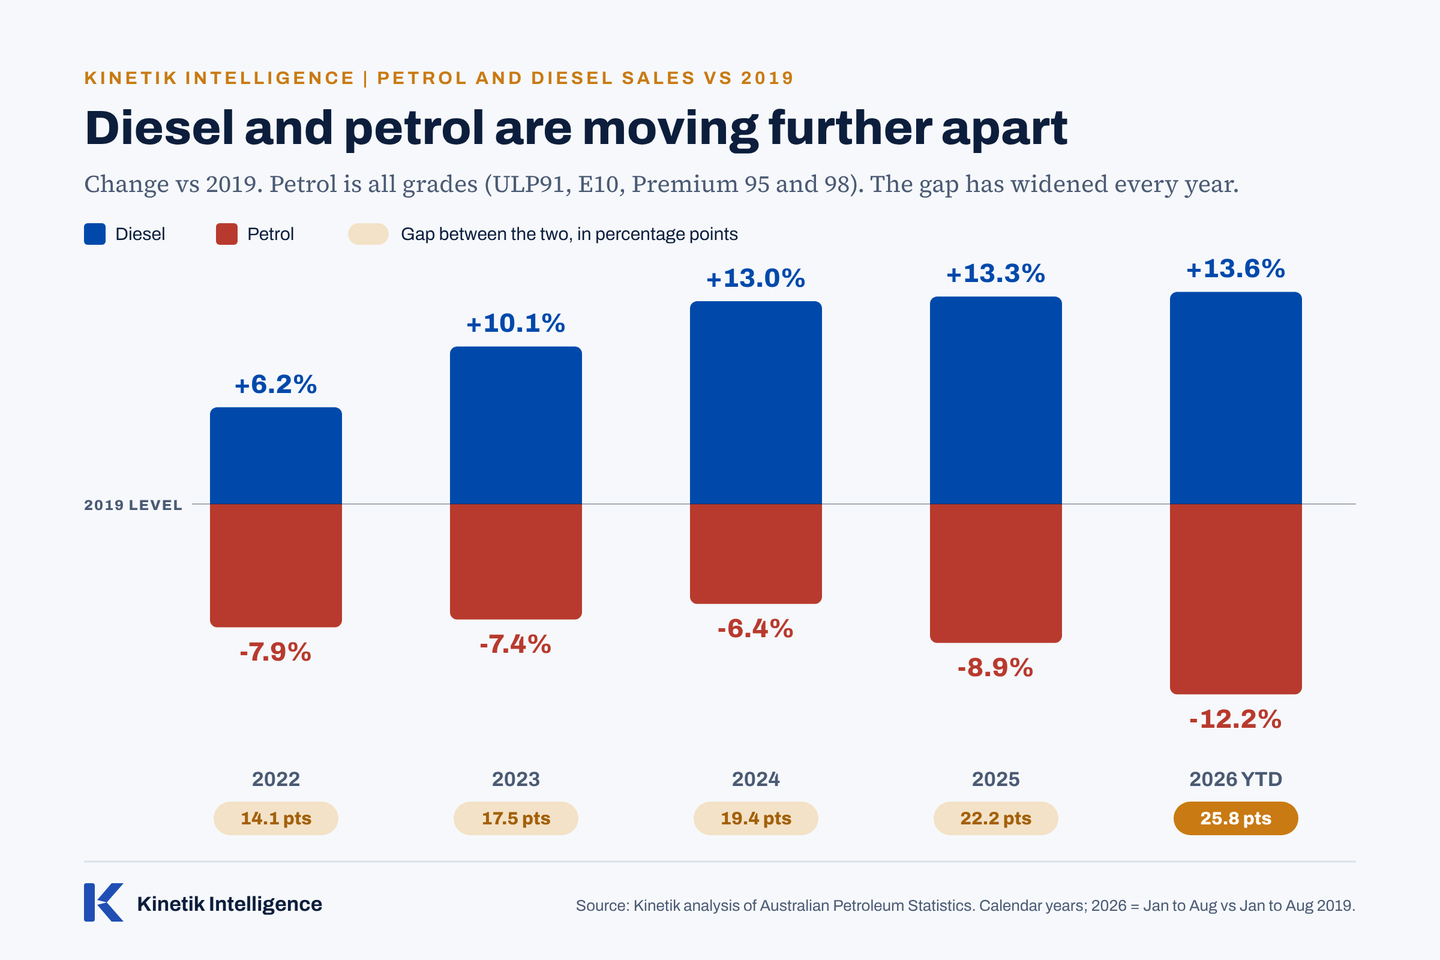
Most of that growth isn't at the bowser. Only ~32% of diesel is sold to retailers, and non-retail diesel is up 17% on 2019 against 6% through retail. Even so, diesel has been fuel retail's cushion: Viva said diesel was the primary driver of its ~2% retail volume growth in the first half, and Ampol's 2.4% came mainly from base-grade petrol and diesel.
That cushion is starting to look thinner. In August, diesel turned negative again: down 5.6% nationally, its biggest monthly fall this year. Since the stock-up in March, diesel has been below last year in four of the five months to August, and year-to-date growth has slipped to just 0.5%.
August probably looks worse than it is. Excise came back on in two steps, on 1 July and 3 August, and it makes sense that buyers brought diesel purchases forward ahead of each increase. That flatters the weeks before and drags on the weeks after. The real measure will be September and October, once the excise timing has washed through.
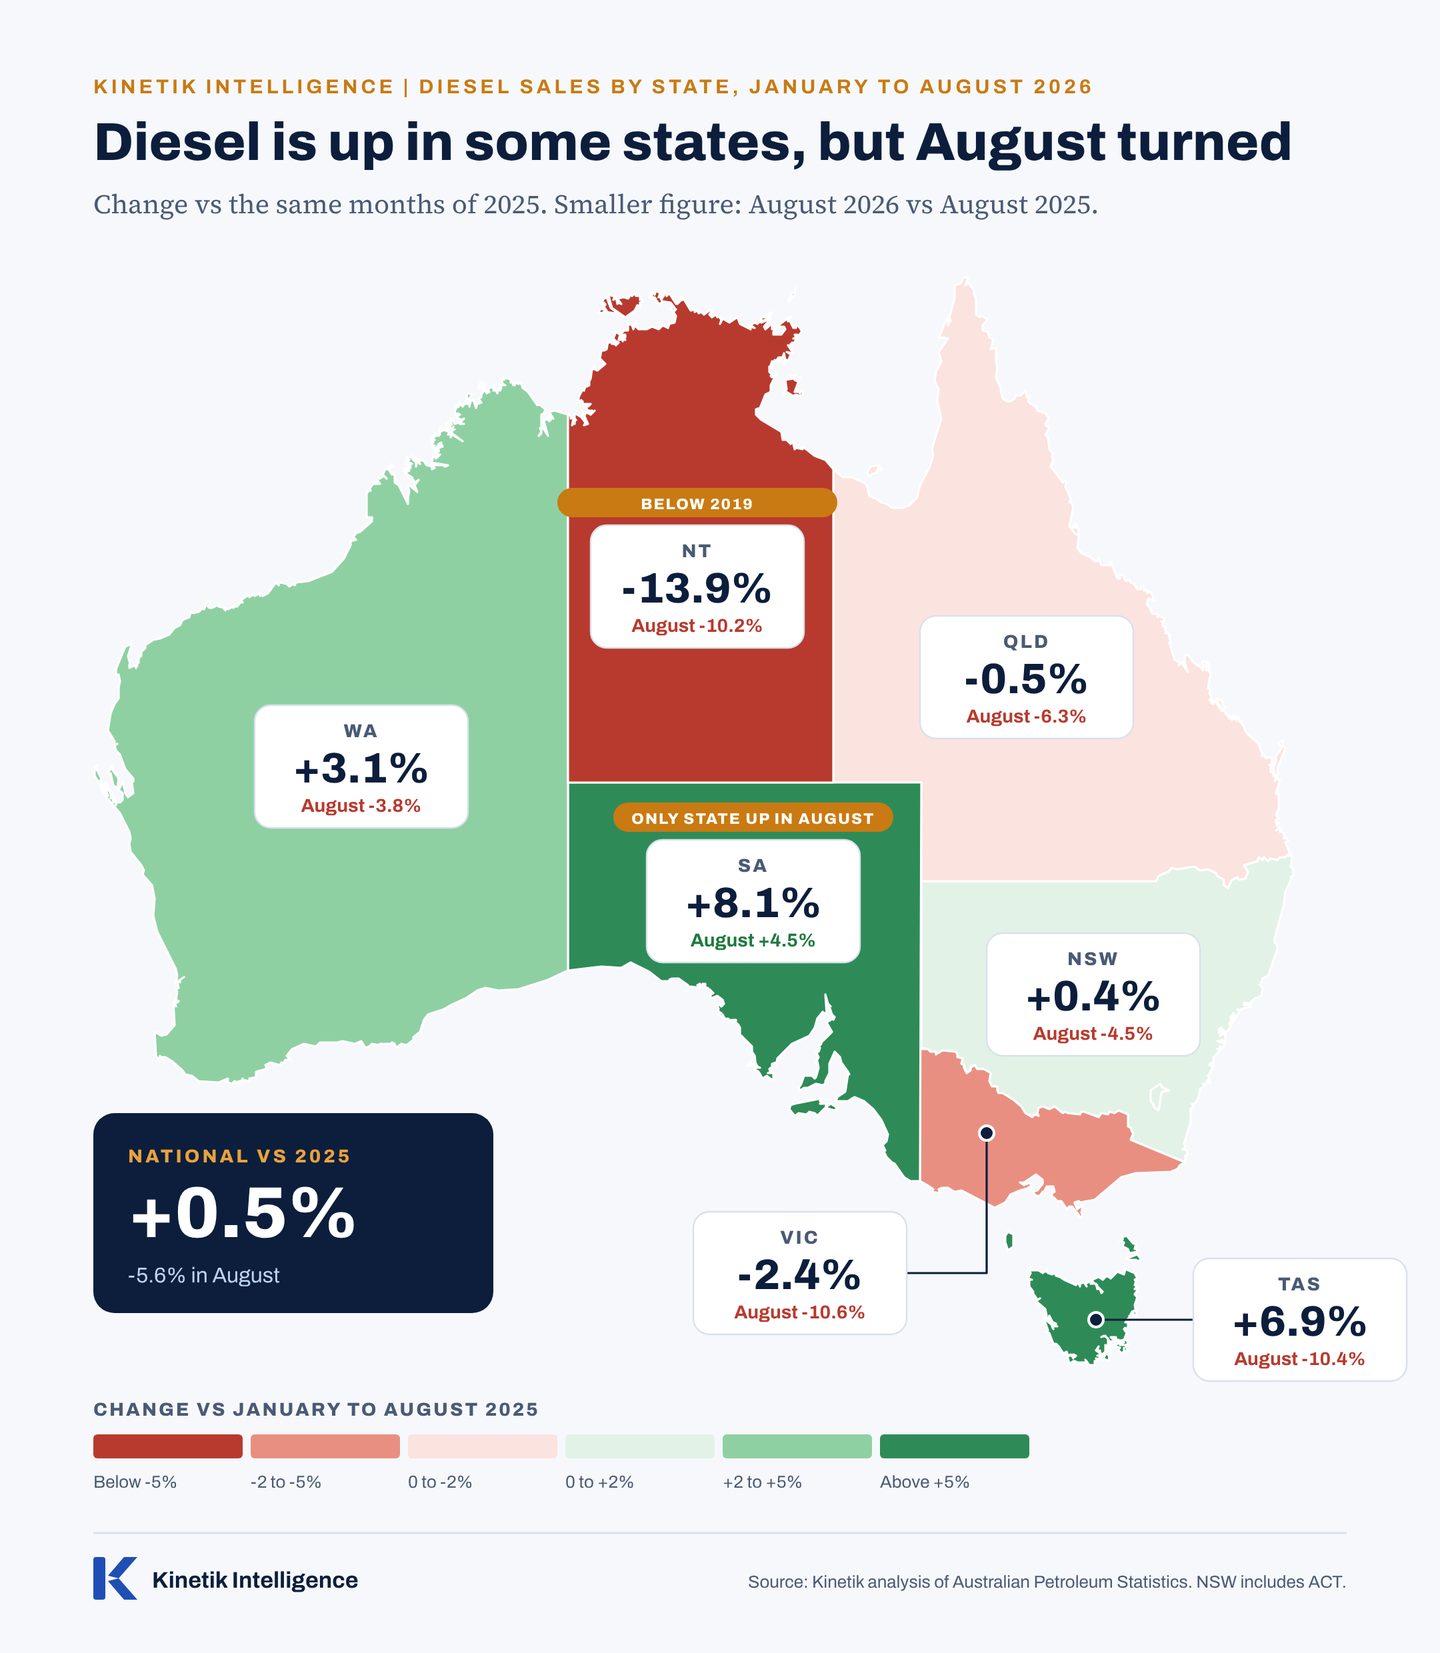
- South Australia and Tasmania are still growing, up 8.1% and 6.9% this year, and Western Australia is ~21% above 2019.
- The Northern Territory is the outlier, down 13.9% this year and the only part of the country below 2019.
- August turned almost everywhere. Victoria, Tasmania and the Northern Territory each fell ~10%. Only South Australia grew.
If diesel softens while petrol keeps falling, the volume cushion fuel retail has leaned on goes with it.
The trips are coming back
When prices first spiked, people cut trips. Weekday car trips across the Sydney Harbour Bridge fell ~6% through March. In a University of Melbourne survey in early April, around 40% of respondents said they had driven less, and a Monash University survey found about 2 in 5 Australians had cut trips. On Transurban's Melbourne toll roads, excluding the new West Gate Tunnel, traffic fell ~3% in both April and May, when Victoria made public transport free to take pressure off the pump. Fares have been half price since June.
Then the driving came back. On those same Melbourne roads, traffic was back to around last year's level from June (+1.5% in June, +0.4% in July, -0.8% in August), while petrol sales fell 4.5% in July and 7.8% in August. So why was petrol still down 8% in August? I think two things. First, timing: excise came back on in two steps, on 1 July and 3 August, and it makes sense that people brought their purchases forward before each increase. That fits June being one of only two months this year above 2025, and it pulls volume out of the weeks that follow. Second, prices stayed elevated. But the trips themselves are back to roughly where they were.
That's the distinction that matters. Cutting trips is behaviour, and behaviour bounces back when prices ease. A car purchase is different. Once a household swaps its petrol car for an EV or a hybrid, it's out of the petrol market, or buying far less and those lost litres can't be replaced.
EVs aren't the cause, but they're why it won't reverse
The narrative that EVs are killing petrol demand isn't supported by the numbers, at least not yet. EVs account for approximately 3% of Australia's vehicle fleet, including plug-in hybrids, with more than 500,000 battery EVs now on the road. Higher fuel prices are likely having a more immediate impact on petrol consumption through changes in driving behaviour than through EV adoption.
But the price shock is also influencing what Australians buy. Battery EVs accounted for approximately 25% of all new vehicle sales in August and September, more than double their share a year earlier. Add conventional hybrids and plug-in hybrids, and around half of all new vehicles sold in those two months were electrified. Only about one in four was petrol-only. In August and September alone, Australians bought 53,376 battery EVs.
That's the part that compounds. Every petrol driver who switches to a battery EV represents fuel demand lost for the life of that vehicle. For fuel retailers, the risk extends beyond the litres. It's also the potential loss of a regular customer and the convenience store purchases that came with their fuel visits. As EV adoption accelerates, both fuel volumes and the customer traffic supporting convenience retail come under increasing pressure.
When prices ease, trips come back. Those litres don't.
What it means for network strategy
Fuel retail has a structural volume problem. There are ~7% more sites than in 2018, selling ~20% less petrol. That's around a quarter fewer litres per site.
The lesson from 2026 is that network strategy has to plan for further decline, not for today's volume. What that means for site investment, traffic counts and how fuel retailers are positioning deserves its own piece, and that article is coming soon.
What I'm watching
- Q4 volume. Prices are rising again, and earlier this year rising prices meant fewer litres.
- Diesel. September and October will show whether August's fall was excise timing or the start of a turn.
- EV sales as prices ease. If ~25% of new vehicle sales holds without a price shock behind it, the decline speeds up again.
The short version, this year's trips will come back, but the litres mostly won't. Petrol demand is falling faster than before COVID, and the cars bought during this crisis will keep it falling. For an industry still adding sites, that's the number to plan around.
Sources
Australian Petroleum Statistics, Department of Climate Change, Energy, the Environment and Water, 2026; ACCC fuel price monitoring, 2026; FCAI VFACTS, 2025 and 2026; BITRE vehicle fleet data, 2026; Transurban traffic updates, 2026; Transport for NSW, 2026; University of Melbourne and Monash University travel surveys, 2026; Victorian Government, 2026; Ampol and Viva Energy company releases, 2026.
Disclaimer: The views and conclusions expressed in this article are my own independent professional opinions based exclusively on publicly available information and observable market data. No confidential, proprietary or non-public information obtained through any current or former employment has been used. These views do not represent those of any current or former employer and do not constitute investment advice.